The PQWT water detector is a professional tool used for locating underground water sources by analyzing natural electric field signals. It is commonly used in borehole drilling, agricultural planning, and water resource surveys
To use a PQWT water detector effectively, follow these essential steps:
1. Understand the Area’s Geology
Before deploying the device, gather background information on the area’s geological features. Understanding rock formations, soil type, and known water tables helps in interpreting data correctly.
Local knowledge or geological maps will be very useful.
2. Prepare the Equipment
Ensure the device is fully charged and all accessories, including electrodes, cables, and water or saline solution (if needed), are ready. Switch on the device to check for functionality. Set the desired depth range based on your project needs (e.g., 100m, 300m, 500m, etc.).
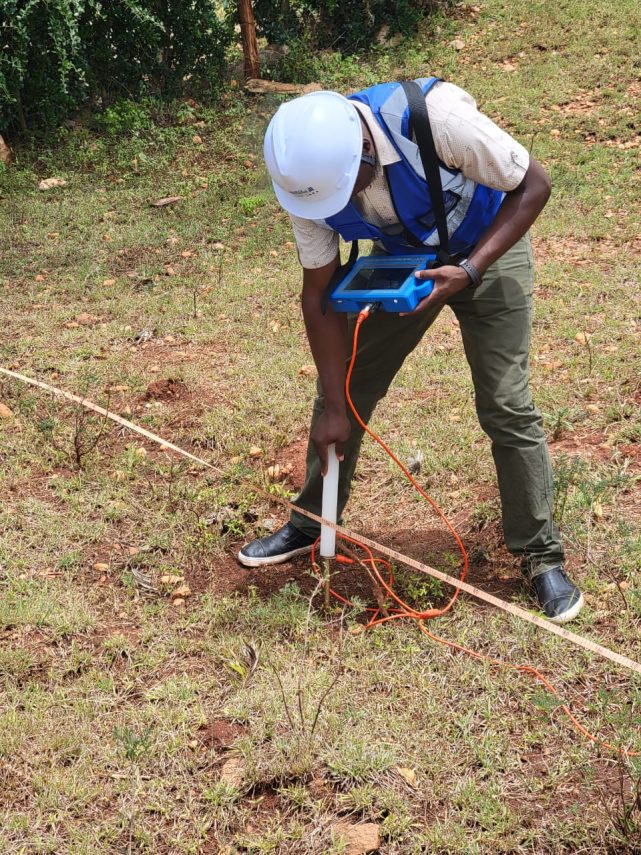
3. Set Up the Electrodes
Lay out the electrode cable along a straight line on the ground. Insert the electrodes at specified intervals, typically 5 to 10 meters apart.
Make sure each electrode is firmly in the ground and maintains good contact using water or saltwater to improve conductivity, especially in dry soils.
4. Connect the Device
Attach the electrode cables to the main unit as indicated in the user manual. On the device’s touch screen interface, select the measurement parameters such as depth, and gain. Calibrate the device if prompted.
5. Start the Survey
Begin the measurement process by pressing the “Start” button. The detector will begin scanning and collecting subsurface data. The process may take three to ten minutes depending on the depth and sub-surface material.
6. Analyze the Results
Once the survey is complete, the device automatically processes the collected data to generate a graph of millivolts (mV) vs. distance (based on the number of points measured).
From this, a 2D color-coded profile is created, showing subsurface conductivity variations.
7. PQWT Data Interpretation
- Lower mV differences often indicate higher conductivity e.g., clay layers, water-saturated zones.
- Higher mV differences usually represent more resistive materials e.g., dry rocks, compact formations.
However, interpretation will depend heavily on the geological context. The same mV reading may suggest different materials in different terrains, making your local geological knowledge critical.
Color Chart and Profile Analysis
The PQWT profile uses a standardized 18-color scale, dynamically adjusted based on the site data. Each color corresponds to a relative range of electrical conductivity:
- Red/Orange – High resistivity (dry rock, compact formations)
- Yellow/Green – Intermediate resistivity (potential water-bearing zones, weathered rock)
- Light Blue/Deep Blue – Low resistivity (clay, saturated zones, conductive materials)
These profiles will help you to visually identify the most promising areas for groundwater or other subsurface targets.
8. Mark the Best Drilling Point
Identify the most promising water point based on the analysis. This is usually where anomalies are consistent and significant across different depths and survey lines. Mark the spot accurately on the ground for drilling or further validation.
9. Save and Backup Data
Save the data on the device and, if necessary, transfer it to a computer or external storage for record-keeping or sharing with professionals.
By following these steps, you can make informed decisions and improve the chances of successful water discovery with a PQWT underground water detector.